Economic policy article
Trade or Aid?
Evidence and Strategic Choices for Bangladesh’s Smooth Transition beyond LDC Status
Subrata Dey · TradeBiz Economy
30 September 2026
Abstract
Bangladesh should make trade and productive transformation the foundation of its development strategy while retaining selective development assistance that removes constraints on competitiveness and protects essential public goods. This article examines that proposition through international research, Bangladesh’s aid and trade trends and a deliberately varied country comparison. World Development Indicators show a marked decline in Bangladesh’s aid dependence alongside rising real income, but these patterns do not establish that aid caused or impeded growth. Official fiscal-year data reveal a predominantly loan-financed assistance portfolio. Consequently, project returns, debt service and foreign-exchange capacity matter as much as the volume of external resources. The proposed transition strategy combines market-access negotiations, efficient imports, standards, logistics, skills and transparent financing. Assistance should be judged by the capabilities and welfare gains it creates; trade should be judged by domestic value added, diversification, productive jobs and resilience.
Abbreviations
ADB — Asian Development Bank; AIIB — Asian Infrastructure Investment Bank; ARDL — autoregressive distributed lag; ERD — Economic Relations Division; FDI — foreign direct investment; GDP — gross domestic product; GNI — gross national income; IDA — International Development Association; IMF — International Monetary Fund; JICA — Japan International Cooperation Agency; LDC — least developed country; ODA — official development assistance; OECD — Organisation for Economic Co-operation and Development; WDI — World Development Indicators; WTO — World Trade Organization.
1 Introduction and policy question
The question “trade or aid?” expresses a legitimate ambition: Bangladesh should be able to finance sustained development through productive activity rather than permanent reliance on external support. Yet choosing between two aggregate flows conceals their different functions. Exports earn revenue through transactions; assistance can finance capabilities that markets undersupply. A development loan is a liability, a grant is a transfer, and an export receipt is payment for goods or services whose production has costs. Their gross dollar values cannot be interpreted as equivalent contributions to national welfare.
The United Nations currently schedules Bangladesh’s LDC graduation for 24 November 2026 and records a national Smooth Transition Strategy issued in February 2025 (United Nations, n.d.). The task is therefore to strengthen an existing transition framework. Graduation should be understood as a change in eligibility for particular international measures, not a declaration that infrastructure, institutional or social-development needs have disappeared. Market-specific transition provisions and financing eligibility require separate examination.
This study asks three questions. How has Bangladesh’s reliance on assistance changed alongside trade and real income? What does international experience establish about the strengths and limits of aid and export-led development? Which financing and reform choices can support a durable transition? A successful transition means sustained productivity, diverse sources of foreign exchange, affordable debt obligations and improved living standards, including for workers affected by structural adjustment.
2 What counts as aid and external finance
ODA comprises official flows with development and welfare as their main purpose that satisfy the relevant concessionality and eligibility rules. OECD headline grant-equivalent accounting measures donor effort; recipient cash-flow measures describe money actually transferred. They should not be spliced into one unqualified time series (OECD, n.d.). The WDI series used here is net ODA received: it is not a series of grants alone and is not the grant-equivalent headline measure.
Classification must distinguish the provider from the instrument. World Bank IDA support can include credits and grants; other World Bank lending should be identified separately. Japan is a bilateral partner and JICA is an implementing agency, so counting Japan and JICA as independent providers could duplicate flows. Technical cooperation, humanitarian assistance and budget support need separate functional labels. Finance outside ODA eligibility still matters for debt and investment, but should retain its own category.
IMF financing serves balance-of-payments and related stabilisation needs rather than specific development projects (IMF, n.d.). It belongs in a wider external-financing account, with facilities, disbursements and repayment terms identified. It is excluded from the provider chart below rather than represented as zero. Commercial borrowing, FDI and remittances likewise require separate accounts: FDI may generate future income transfers, while remittances are private transfers rather than official aid.
| Account | What should be recorded | Treatment |
|---|---|---|
| Grants | Cash grants and identifiable technical assistance | No principal repayment obligation |
| Development loans | Disbursement, terms, outstanding principal | Concessionality and repayment exposure |
| Other official finance | Non-ODA public financing | Separate from ODA |
| IMF financing | Facility-specific actual drawings | Separate stabilisation account |
| Private flows | FDI, remittances, commercial borrowing | Separate ownership and liability structure |
3 Literature and competing arguments
Moyo (2009) argues that systematic government-directed assistance can perpetuate dependence, weaken accountability and sustain inefficient institutions. Her critique in Dead Aid is a useful challenge to the assumption that transferring resources necessarily produces development. Its principal target is sustained official support to governments, rather than all emergency or charitable assistance. The policy implication worth testing is whether predictable external funding can reduce pressure to mobilise domestic revenue or satisfy citizens. It is a hypothesis about incentives, not proof that every aid-financed intervention fails.
Rajan and Subramanian (2005) find little robust evidence of either a positive or negative aggregate aid–growth relationship after addressing selection problems. Their conclusion cautions against promising automatic growth from larger inflows. It also does not establish that aid is inherently harmful. Aggregation can conceal different intervention purposes, implementation quality and delayed effects.
Clemens et al. (2012) reconsider timing and aid categories and find that increases in assistance are followed, on average, by modest increases in investment and growth. Effects vary across recipients and diminish at high levels. Their findings challenge categorical rejection of aid while retaining a reason to scrutinise effectiveness. Comparing these studies shows why the time horizon, reverse causation and statistical specification matter.
The economic argument for assistance is strongest where financing constraints and public-good problems prevent valuable investment. Disease control, basic education and disaster resilience can improve welfare even when a short-run GDP regression detects little effect. The argument against poorly designed assistance concerns waste, distorted incentives, procurement restrictions, recurrent-cost burdens and exchange-rate pressure. A grant-funded asset can still become fiscally costly if operation and maintenance are unfunded.
Trade offers scale, competition, learning and foreign-exchange earnings. Those mechanisms depend on firm capabilities and institutions. High exports can coexist with imported-input dependence, environmental damage, low domestic value added or volatile commodity revenues. Export expansion can also concentrate benefits geographically and expose workers to demand shocks. “Trade works for all countries” is therefore too broad: the stronger proposition is that successful integration can support development when domestic policies enable learning and adjustment.
Neither literature establishes a universal winner. Assistance and trade may be complementary when external resources remove constraints on export production. They may conflict when assistance-financed spending drives up costs without increasing tradable capacity, or when tied procurement prevents local learning. Bangladesh’s strategy should identify these mechanisms project by project.
4 Data and methodology
This is a descriptive statistical and comparative policy study, not an estimated causal econometric study. Annual WDI observations were retrieved through the World Bank API on 30 September 2026. The common Bangladesh window is 1990–2023 because net ODA is unavailable beyond 2023 in this retrieved series. Growth and trade observations extending to 2025 are shown separately. Reference years follow WDI labels; underlying national accounts may reflect fiscal-year reporting. ERD’s FY2024–25 figures are a separate administrative account and are not appended to the ODA series.
Real GDP per capita is measured in constant 2015 US dollars. Its change measures inflation-adjusted income per person, not purchasing-power-parity welfare differences across countries. Real exports use the constant-price goods-and-services series. Current-dollar exports are displayed only as transaction values. Ratios use their stated GDP or GNI denominator. Missing observations remain missing; no interpolation or conversion of missing values to zero is used.
For a series Z, the index is Iₜ = 100 × Zₜ / Z₁₉₉₀. Period averages are arithmetic means of available annual observations. Income change is 100 × (y₂₀₂₃ / y₁₉₉₀ − 1). These transformations allow transparent comparison without implying common starting income levels. Country cases are purposive contrasts, not a representative or randomly selected sample. Zambia and Rwanda are included to counter both success-only selection and an undifferentiated narrative about Africa.
No regression coefficients or significance claims are presented. A later ARDL model could relate real income to aid intensity, trade performance and investment, but would require integration tests, defensible lag selection, structural-break analysis and residual diagnostics. GDP-denominated regressors introduce denominator effects; export activity is also part of national accounting. Aid may rise after poor performance and income may increase trade. Consequently, even a significant coefficient would not independently resolve causation. An exploratory model should be added only if it improves the economic question rather than decorates the article.
5 Bangladesh assistance and financing
Table 1 and Figure 1 show declining relative aid dependence alongside substantial real-income gains. Net ODA/GNI fell from 5.55% in 1990 to 1.25% in 2023. Real GDP per capita rose from US$473 to US$1,885 in constant 2015 prices. These are observed outcomes, not an attribution of growth to a particular financing source (World Bank, 2026a).
A falling assistance ratio can result from national income growing faster than receipts. It does not necessarily indicate a deliberate withdrawal from external financing. Absolute net receipts reached US$5.68 billion in 2023. The financing question is therefore changing composition and productive use, rather than whether Bangladesh has ceased receiving assistance.
| Year | Net ODA US$ bn | ODA / GNI % | Real growth % | Real income per person US$ |
|---|---|---|---|---|
| 1990 | 1.79 | 5.55 | 5.62 | 473 |
| 2000 | 0.98 | 1.77 | 5.29 | 621 |
| 2010 | 1.22 | 0.98 | 5.57 | 944 |
| 2020 | 5.38 | 1.38 | 3.45 | 1,605 |
| 2023 | 5.68 | 1.25 | 5.78 | 1,885 |
Table 1. Bangladesh aid and growth benchmarks. Source: World Bank (2026a); income uses constant 2015 US dollars.
Figure 1. Bangladesh aid dependence growth and real income
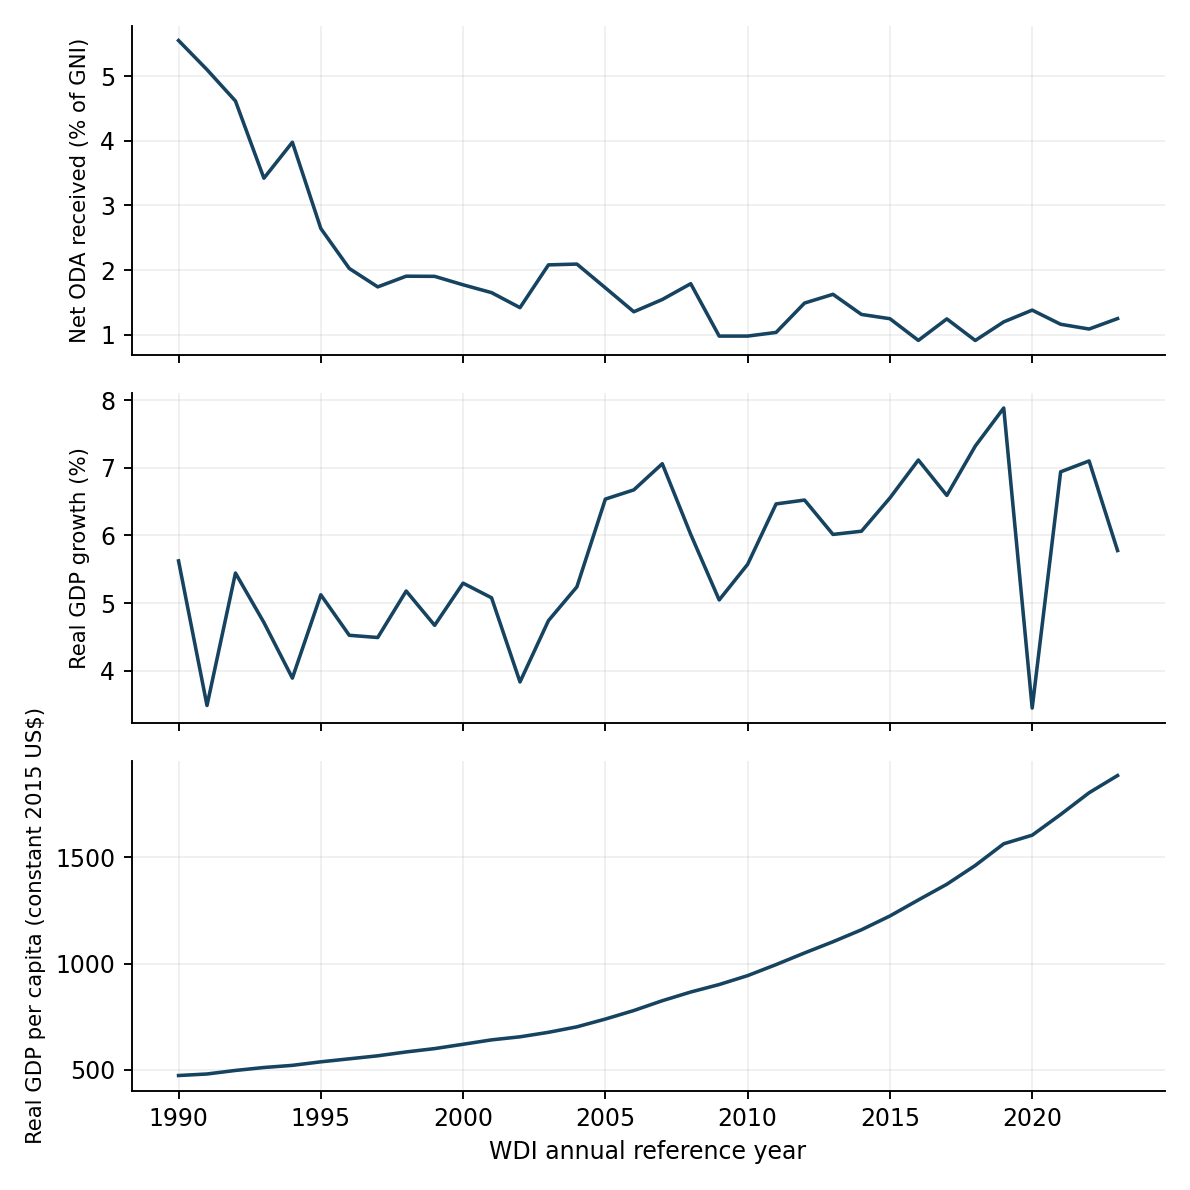
Source: World Bank (2026a), 1990–2023. Separate panels use different units; co-movement does not establish causation.
ERD reports FY2024–25 disbursements of US$8,568.40 million: grants US$454.56 million and loans US$8,113.84 million. Grants represent 5.31%. These gross administrative receipts differ from net ODA (ERD, 2025, Annexure 4).
| Selected partner | Grant US$ m | Loan US$ m | Total US$ m |
|---|---|---|---|
| ADB | 10.38 | 2,512.09 | 2,522.47 |
| World Bank IDA | 115.62 | 1,896.97 | 2,012.59 |
| Japan | 9.58 | 1,569.57 | 1,579.15 |
| Russia | 0.00 | 674.93 | 674.93 |
| AIIB | 0.39 | 526.98 | 527.37 |
| China | 0.00 | 414.70 | 414.70 |
| India | 0.00 | 184.63 | 184.63 |
| EU | 64.58 | 0.00 | 64.58 |
| USAID | 63.49 | 0.00 | 63.49 |
| Germany GIZ KfW | 13.34 | 20.70 | 34.04 |
Table 2. Selected FY2024–25 partners. Source: ERD (2025), Annexure 4, printed p.118. Japan is the reported country category, not a JICA-only total. Selected rows do not exhaust the portfolio.
Figure 2. Selected partners and financial instruments
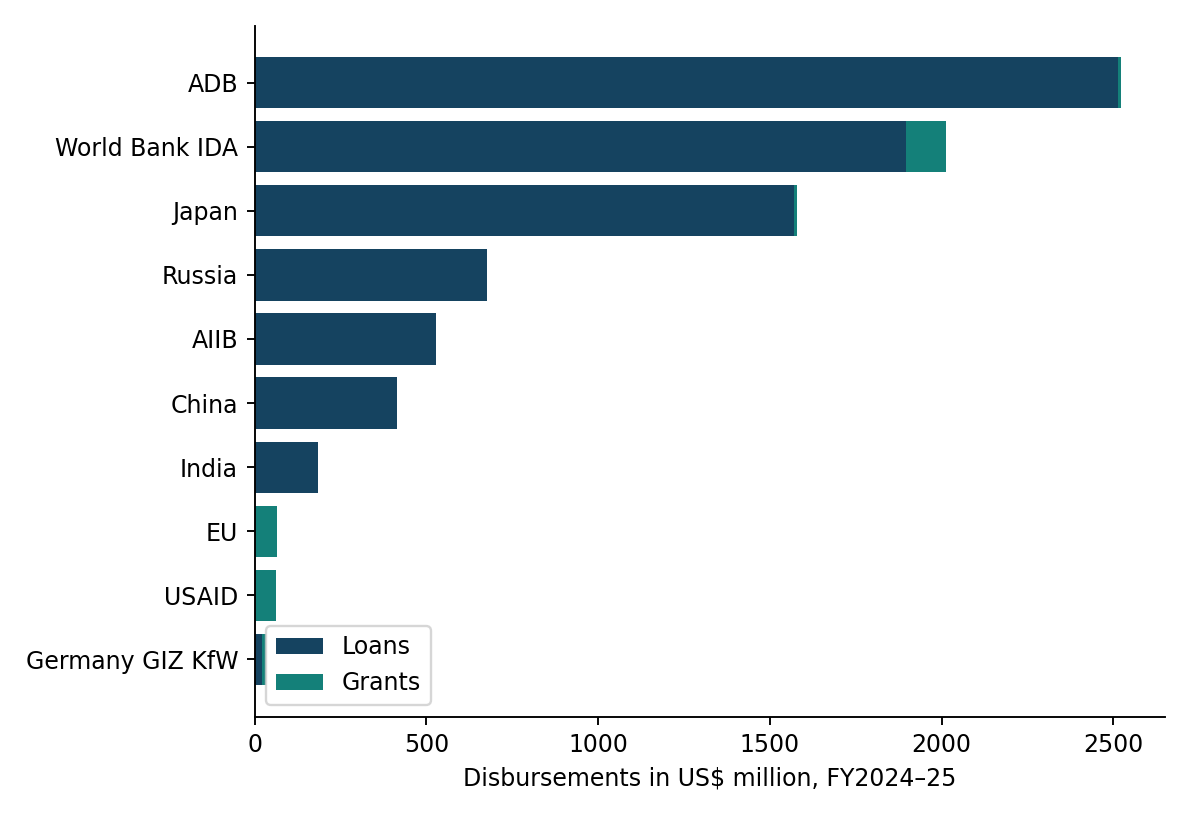
Source: ERD (2025), Annexure 4. IMF financing is outside this chart. Official-table rounding and subtotal inconsistencies are not silently corrected.
A predominantly loan-financed portfolio calls for stronger appraisal, maintenance provision and repayment planning. Cheap borrowing is valuable only when the funded activity produces sufficient economic or social benefit. Projects earning taka can still create foreign-currency repayment exposure. Export earnings help meet that exposure, but the relationship depends on the national balance of payments rather than an assumed direct flow from an individual project.
6 Bangladesh trade and development
Exports of goods and services increased from US$1.87 billion in 1990 to US$57.55 billion in 2023. Figure 3 also uses constant-price exports, so its expansion is not merely nominal dollar growth. Exports/GDP rose from 5.91% to 13.16% over those benchmarks, but the annual path is not continuously upward (World Bank, 2026a).
| Year | Exports US$ bn | Exports / GDP % | Imports / GDP % | Real GDP growth % |
|---|---|---|---|---|
| 1990 | 1.87 | 5.91 | 13.06 | 5.62 |
| 2000 | 6.59 | 12.34 | 16.98 | 5.29 |
| 2010 | 18.47 | 16.02 | 21.78 | 5.57 |
| 2020 | 39.05 | 10.44 | 15.83 | 3.45 |
| 2023 | 57.55 | 13.16 | 17.83 | 5.78 |
| 2024 | 47.09 | 10.46 | 16.32 | 4.22 |
| 2025 | 50.72 | 11.12 | 16.83 | 3.49 |
Table 3. Trade and growth benchmarks. Source: World Bank (2026a). Exports include goods and services and are not EPB merchandise totals. Latest observations may be revised.
Figure 3. Bangladesh real exports income and trade ratios
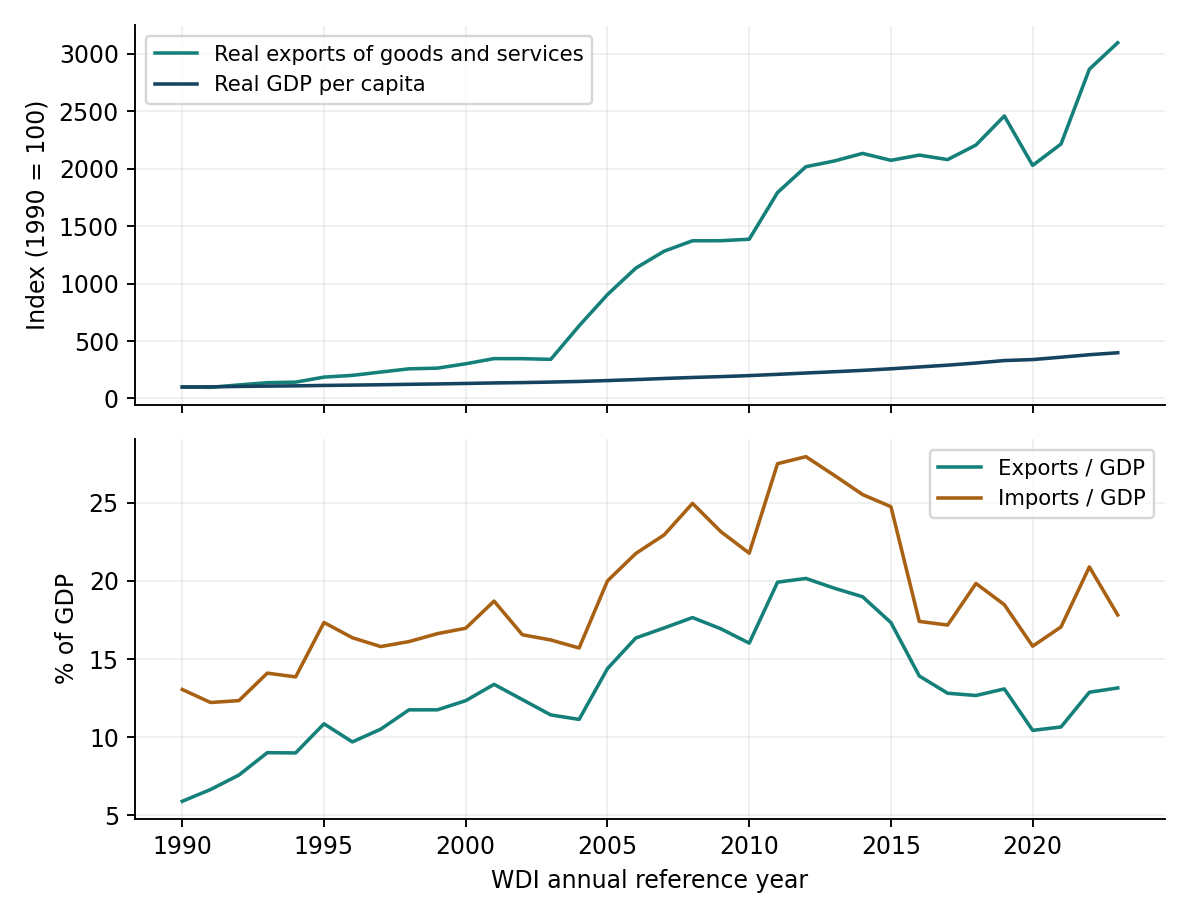
Source: World Bank (2026a). Top panel: constant-price indices. Bottom panel: goods-and-services ratios to GDP.
The growth of exports and real income is consistent with trade contributing to development, but other channels include investment, domestic demand, human capital and institutional change. The latest WDI export observations must not be interpreted as a continuous EPB merchandise series. Changes in reporting, prices, exchange rates and national-account estimates can affect apparent breaks; the table presents the retrieved series without claiming a unique explanation for recent changes.
Export receipts also overstate the domestic income retained when production relies heavily on imported inputs. Imported machinery and intermediates can raise productivity, so imports should not automatically be described as a failure. A sustainable strategy improves the return earned from imports through production, technology transfer and competitive exports. Restricting inputs indiscriminately can undermine the very exporters the policy seeks to protect.
Trade performance should therefore be monitored through domestic value added, new products and markets, firm entry and survival, productivity and earnings. Product concentration is not quantified here because the retrieved aggregate dataset lacks the required harmonised product-level observations. Adding an invented diversification index would create false precision. That extension requires a consistent merchandise database and an explicit concentration measure.
7 Comparative country evidence
| Country | ODA / GNI 2023 % | Exports / GDP 2023 % | Real income change 1990–2023 % |
|---|---|---|---|
| Bangladesh | 1.25 | 13.16 | 298.2 |
| South Korea | — | 41.32 | 275.8 |
| Vietnam | 0.20 | 86.74 | 448.4 |
| Mauritius | 0.60 | 69.04 | 194.6 |
| Botswana | 1.50 | 32.90 | 80.0 |
| Zambia | 5.49 | 40.85 | 51.5 |
| Rwanda | 9.55 | 23.70 | 171.8 |
Table 4. Purposive country comparisons. Source: World Bank (2026a). Korea’s ODA-recipient observation is unavailable, not zero. Ratios across economies reflect size and structure as well as policy.
Figure 4. Real income trajectories in selected economies
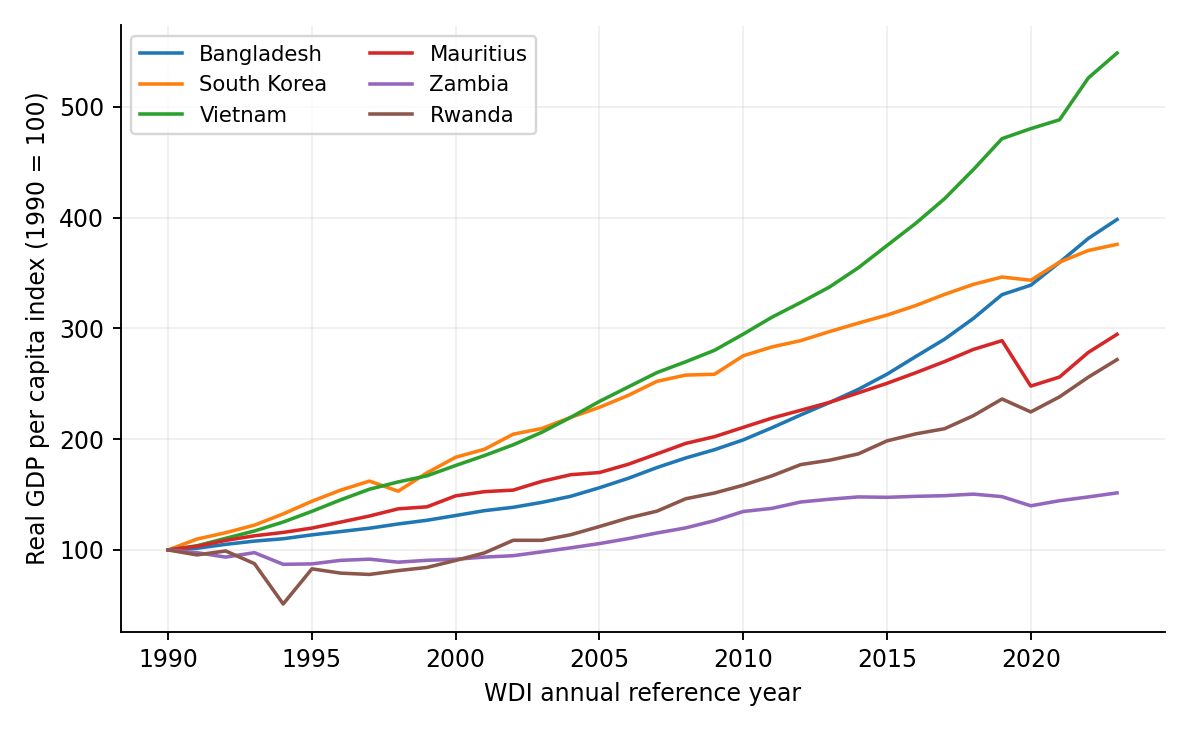
Source: World Bank (2026a). Indexing compares proportional change, not absolute income. Botswana is included in Table 4 but omitted from this chart for readability.
South Korea is a strong counterexample to a simple separation of aid and trade. The World Bank describes its transition from a post-war recipient to an advanced economy through investment in education, infrastructure and technology. Korea received development financing before becoming a donor (World Bank, 2026b). Its experience supports examining how external resources interact with domestic capability building; it does not support attributing the transformation exclusively to either assistance or exports.
Vietnam provides a contemporary trade-integration comparison. Yet the World Bank’s Trading Up report argues that continued progress requires higher-value activities, services and stronger links between foreign-invested exporters and domestic firms (World Bank, 2024). Bangladesh should learn from integration while recognising that assembly exports alone may not generate sufficient domestic learning. Expanding gross exports and retaining greater value are separate objectives.
Mauritius combines a high export ratio with substantial income gains in this dataset. Zambia combines considerable trade exposure with more modest long-run income gains. Botswana offers another comparison between export exposure and income outcomes. These observations challenge the assumption that a large trade share guarantees the same development trajectory. Explaining their differences requires evidence on production structure and institutions that an aggregate ratio cannot supply.
Rwanda recorded sizeable real-income growth while still receiving substantial net ODA relative to GNI. This is inconsistent with claiming that every aid-dependent African economy necessarily stagnates. It does not establish that aid caused the growth. Zambia’s weaker relative trajectory similarly cannot establish that assistance harmed it. Country histories involve shocks, starting conditions and policies; a graph cannot supply the missing counterfactual.
The countries were chosen to expose competing interpretations, not to count how many were “saved” or “damaged” by aid. A defensible causal claim would require an explicit intervention, comparison group and identification strategy. For Bangladesh, the practical lesson is to examine how resources change incentives and productive capability, while avoiding mechanical transplantation of another country’s policy package.
8 Strategic choices for Bangladesh
The recommended strategy is trade-led transformation supported by selective assistance and domestic resource mobilisation. Market-access negotiations should proceed alongside reform of the costs and capabilities that determine whether firms can use that access. WTO members have encouraged a smooth transition before preferences are withdrawn, but that encouragement does not create identical market-access rights in every destination (WTO, 2023). Negotiators should map actual eligibility, rules of origin and deadlines market by market.
First, prioritise reliable logistics and transparent border procedures. Measure clearance time and variation, not simply the number of digital systems installed. Assistance should finance interoperability, risk management, testing and staff capability where the benefits can be demonstrated. Modernisation that adds a digital layer to unchanged approvals may increase rather than reduce compliance costs.
Second, improve competitive access to machinery and intermediate inputs. Tariff structures and administrative procedures should be evaluated for their effects on both revenue and export incentives. Reform should proceed with fiscal analysis and support for affected firms and workers. Temporary protection needs a clear public purpose, review date and measurable capability target; indefinite support can preserve low productivity.
Third, use grants for activities with high social returns and limited direct cash revenue, where available. These can include standards infrastructure, public health, workforce inclusion and climate resilience. Use concessional loans for well-appraised investments with credible operating arrangements. Assess foreign-exchange exposure, procurement conditions, maintenance and demand under adverse scenarios. The preferred lender is the one offering a suitable overall package, not necessarily the largest headline commitment.
Fourth, build domestic firms’ capacity to enter and upgrade within supply chains. Support should respond to verifiable gaps in management, skills, quality and finance. Publicly supported programmes should disclose eligibility, results and expiry provisions. Large firms should not receive permanent privileged access at the expense of smaller entrants. Assistance can help fund supplier development, but continuation should depend on demonstrated learning and commercial viability.
Fifth, strengthen domestic revenue and accountability. A declining ODA/GNI ratio is not a substitute for tax capacity. Businesses value predictable obligations and public services; poorly administered revenue measures can undermine formalisation and trade. Revenue reform and trade facilitation therefore require coordination rather than separate targets pursued without regard to each other.
Finally, protect adjustment and resilience. Training and income support can make structural change politically and socially sustainable. Humanitarian needs should not be judged solely by export returns. Climate resilience and essential health spending have development value even when they cannot produce a short-term commercial repayment stream. Reducing dependence should mean greater capacity to manage shocks, rather than premature rejection of beneficial support.
9 Implementation and monitoring
| Priority and horizon | Proposed coordination | Outcome indicator |
|---|---|---|
| First 12 months: map market access and financing | Commerce, ERD, Finance, relevant agencies | Published destination rules and financing inventory |
| First 12 months: appraise and prioritise projects | Finance, ERD, Planning, implementing bodies | Appraisal, maintenance and currency-risk disclosure |
| Years 1–3: improve borders and standards | NBR, Commerce, ports, standards bodies | Clearance-time distribution and certification costs |
| Years 1–3: develop suppliers and skills | Industry, education, private sector | Supplier contracts, productivity and placement |
| Annual review: monitor resilience and finance | Finance, ERD, Bangladesh Bank, statistics bodies | Debt service, export diversification and real earnings |
Table 5. Proposed implementation matrix. Responsibilities are analytical recommendations, not announced government assignments. Numeric targets should be set after baseline measurement.
Monitoring should distinguish outputs from outcomes. Training attendance is an output; durable placement and earnings are outcomes. A completed port asset is an output; lower transport cost and reliable service are outcomes. Disbursement is a financing event, not evidence of development success. Annual reporting should connect expenditure and financing terms to observable results and explain projects that do not meet expectations.
10 Conclusion
The evidence supports moving beyond a categorical choice between trade and aid. Bangladesh has achieved considerable real-income growth while reducing net ODA dependence relative to national income. International cases show that assistance can coexist with progress and that large trade shares do not guarantee equal outcomes. Neither pattern alone proves causation. The strongest strategy makes productive trade the enduring source of opportunity and uses external support where it builds capabilities, safeguards welfare or enables necessary adjustment.
Smooth transition should be judged by competitiveness, diversification, repayment capacity and improved lives. Selective assistance can contribute to those goals, but its value must be demonstrated. Export growth can contribute to them, but gross receipts should not replace scrutiny of domestic value added and distribution. Bangladesh’s practical objective is to turn temporary advantages and external resources into institutions and capabilities that can sustain development over time.
References
Clemens, M.A., Radelet, S., Bhavnani, R.R. and Bazzi, S. (2012) “Counting chickens when they hatch: timing and the effects of aid on growth”, The Economic Journal, 122(561), pp. 590–617. https://doi.org/10.1111/j.1468-0297.2011.02482.x. Accessible working-paper version: https://www.cgdev.org/publication/counting-chickens-when-they-hatch-timing-and-effects-aid-growth-working-paper-44. (Online sources accessed: 30 September 2026.)
ERD (2025) Annual Report 2024–2025. Dhaka: Economic Relations Division, Ministry of Finance, Annexure 4, p.118. https://objectstorage.ap-dcc-gazipur-1.oraclecloud15.com/n/axvjbnqprylg/b/V2Ministry/o/office-erd/2024/12/324a66bf99cc48488c21493d2de53ce5.pdf. (Online sources accessed: 30 September 2026.)
IMF (n.d.) IMF lending. https://www.imf.org/en/about/factsheets/imf-lending. (Online sources accessed: 30 September 2026.)
Moyo, D. (2009) Dead Aid: Why Aid Is Not Working and How There Is a Better Way for Africa. New York: Farrar, Straus and Giroux. Scope cross-checked against IMF Finance & Development, September 2009 book review: https://www.imf.org/external/pubs/ft/fandd/2009/09/books.htm. Discussion here is a paraphrase, not a quotation. (Online sources accessed: 30 September 2026.)
OECD (n.d.) Official development assistance definition and coverage. https://www.oecd.org/en/topics/sub-issues/oda-eligibility-and-conditions/official-development-assistance--definition-and-coverage.html. (Online sources accessed: 30 September 2026.)
Rajan, R. and Subramanian, A. (2005) Aid and growth: what does the cross-country evidence really show? IMF Working Paper 05/127. Washington, DC: IMF. https://doi.org/10.5089/9781451861464.001. (Online sources accessed: 30 September 2026.)
United Nations (n.d.) Bangladesh graduation status. LDC Portal. https://www.un.org/ldcportal/node/858. (Online sources accessed: 30 September 2026.)
World Bank (2024) Viet Nam 2045: Trading Up in a Changing World. https://www.worldbank.org/en/country/vietnam/publication/viet-nam-2045-trading-up-in-a-changing-world. (Online sources accessed: 30 September 2026.)
World Bank (2026a) World Development Indicators. API dataset, retrieved 30 September 2026. https://api.worldbank.org/v2/. Series and country coverage listed in the statistical appendix. (Online sources accessed: 30 September 2026.)
World Bank (2026b) Republic of Korea overview. https://www.worldbank.org/ext/en/country/korea. (Online sources accessed: 30 September 2026.)
WTO (2023) WTO members reach deal to support least-developed countries on path to graduation, 23 October. https://www.wto.org/english/news_e/news23_e/ldevc_23oct23_e.htm. (Online sources accessed: 30 September 2026.)
Statistical appendix and reproducibility
World Bank indicator codes: DT.ODA.ODAT.CD — net ODA received, current US$; DT.ODA.ODAT.GN.ZS — net ODA received/GNI; NY.GDP.MKTP.KD.ZG — annual real GDP growth; NY.GDP.PCAP.KD — GDP per capita, constant 2015 US$; NE.EXP.GNFS.CD — exports, current US$; NE.EXP.GNFS.ZS — exports/GDP; NE.IMP.GNFS.ZS — imports/GDP; NE.EXP.GNFS.KD — exports, constant 2015 US$. Country codes: BGD, KOR, VNM, MUS, BWA, ZMB, RWA.
Retrieval format: https://api.worldbank.org/v2/country/BGD/indicator/DT.ODA.ODAT.CD?format=json&per_page=100. Replace the country and indicator codes to reproduce each series. Database update dates vary by series; the growth-series response reports 13 July 2026. Data downloaded on 30 September 2026 are a reproducible vintage, not a guarantee against later revision.
ERD data were visually checked against Annexure 4. The printed grant and loan totals reconcile to the grand total, while some printed bilateral and multilateral subtotals do not reconcile exactly. Selected partner rows are reproduced without changing those source entries. These data describe ERD coverage and should not be treated as exhaustive totals for all NGO, humanitarian or private flows. FY2025–26 assistance totals were not verified for this study; FY2024–25 is the latest verified administrative snapshot used here.
Appendix table of period averages
| Period | Mean ODA / GNI % | Mean exports / GDP % | Mean real growth % |
|---|---|---|---|
| 1990–1999 | 3.29 | 9.28 | 4.71 |
| 2000–2009 | 1.64 | 14.31 | 5.55 |
| 2010–2019 | 1.20 | 16.45 | 6.61 |
| 2020–2023 | 1.22 | 11.79 | 5.82 |
Source: author calculations from World Bank (2026a). Averages are arithmetic means, not ratios of aggregate period totals.
Back to top