TRADEBIZ ECONOMY
From Global Conflict to Domestic Prices
Trade, energy, shipping and exchange-rate cost transmission in Bangladesh
Research article | 21 September 2026
Subrata Kumer Dey
Founder, TradeBiz Economy
| Independent-analysis notice TradeBiz Economy is an independent initiative. The analysis and opinions in this article are provided for educational and public-information purposes. They do not represent the official position of the Government of Bangladesh or any other organisation. |
|---|
Abstract
Bangladesh is exposed to global conflict through more than the invoice price of imported oil or grain. Conflict can disrupt production and shipping routes, raise freight and insurance premiums, lengthen voyages, intensify foreign-exchange demand and increase working-capital costs. These shocks then affect electricity, transport, fertiliser, food and industrial inputs before reaching consumer prices and export competitiveness. This article maps those channels using World Development Indicators, the World Bank Pink Sheet, the Federal Reserve Bank of New York’s Global Supply Chain Pressure Index and partner-reported UN Comtrade data. It also estimates an exploratory single-equation dynamic ordinary least squares inflation model for 2002–2024, with a lagged dependent variable and Newey–West heteroskedasticity- and autocorrelation-consistent standard errors.
The evidence shows a pronounced post-2021 stress episode. Bangladesh’s annual-average official exchange rate moved from Tk85.1 per US dollar in 2021 to Tk115.6 in 2024, while consumer-price inflation rose from 5.5% to 10.5%. Brent crude averaged almost US$100 per barrel in 2022. The regression associates a 10% annual increase in Brent prices with approximately 0.21 percentage points higher inflation, conditional on the included variables; this relationship is borderline statistically significant and should not be read as causal. Exchange-rate and supply-chain coefficients are imprecisely estimated in the small annual sample, although the descriptive evidence and transmission logic remain economically important. The policy priority is therefore resilience: transparent fuel-price adjustment, better-targeted support, deeper foreign-exchange markets, diversified sourcing, strategic inventories, trade finance and energy-efficiency measures that protect export firms without suppressing necessary price signals.
Keywords: Bangladesh; imported inflation; global conflict; shipping; exchange rate; energy; trade; export competitiveness
List of abbreviations
| Abbreviation | Meaning |
|---|---|
| ADB | Asian Development Bank |
| ADL | Autoregressive distributed lag model |
| BDI | Baltic Dry Index |
| CPI | Consumer Price Index |
| FOB | Free on board |
| GSCPI | Global Supply Chain Pressure Index |
| HAC | Heteroskedasticity- and autocorrelation-consistent |
| HS | Harmonized System |
| IMF | International Monetary Fund |
| LNG | Liquefied natural gas |
| OLS | Ordinary least squares |
| UNCTAD | UN Trade and Development |
| USD | United States dollar |
| VAR | Vector autoregression |
| VECM | Vector error-correction model |
| WDI | World Development Indicators |
1. Introduction
Global conflict reaches an import-dependent economy through a network of markets rather than a single border. The Russia–Ukraine war affected Black Sea grain, fertiliser and energy markets. Attacks and insecurity around the Red Sea caused vessels to avoid the Suez route, while tension in and around the Gulf increased the risk premium attached to oil, liquefied natural gas (LNG) and maritime insurance. These shocks interact with climate-related disruptions and domestic financial conditions. For Bangladesh, the result can be a simultaneous rise in the dollar price of imports, the taka cost of each dollar, the freight charge per shipment and the financing cost of holding inventories.
This question has immediate relevance. Reuters reported on 21 September 2026 that Bangladesh raised administered fuel prices by up to 17.4% after a global oil and shipping-cost surge; diesel rose from Tk115 to Tk135 per litre. Reuters also reported earlier in September that elevated LNG prices and supply disruption were affecting electricity availability and industrial operations (Reuters, 2026a; Reuters, 2026b). These are current developments, not observations in the historical econometric sample. They are used as context and as a stress test of the transmission framework, not as proof of an estimated 2026 effect.
The study asks four questions: (i) which major product groups link Bangladesh to conflict-exposed origins and routes; (ii) how did commodity prices, the exchange rate, supply-chain pressure and trade values change in recent years; (iii) what does a parsimonious historical model suggest about inflation transmission; and (iv) which practical measures can reduce exposure while preserving market incentives? The contribution is to place product exposure, macroeconomic trends and transmission mechanisms in one Bangladesh-focused framework.
2. Bangladesh’s trade exposure to conflict-affected regions
2.1 What Bangladesh imports
Bangladesh’s strategic exposure is concentrated in products with broad downstream effects. Mineral fuels and LNG influence power, transport, irrigation and industrial heat. Wheat and other cereals affect food prices and milling. Fertilisers affect farm costs and subsequent food supply. Iron and steel, plastics and organic chemicals enter construction and manufacturing. Cotton and textile inputs matter for the export-oriented garment value chain. Even when a product is not purchased directly from a battlefield country, its reference price may be determined in a globally integrated market affected by that conflict.
The origin map must therefore be interpreted in two ways. Direct exposure is the value shipped from a selected partner to Bangladesh. Indirect exposure arises when conflict changes the world benchmark price, shipping route or insurance premium applied to suppliers elsewhere. The Gulf economies are particularly important for energy and petrochemicals; Russia and Ukraine are relevant to fuels, cereals, fertilisers and metals; and the Red Sea/Suez corridor matters to trade with Europe and the Mediterranean.
Table 1. Leading product groups in selected partner-reported exports to Bangladesh, cumulative 2020–2024
| HS chapter | Product group | US$ bn |
|---|---|---|
| 27 | Mineral fuels, mineral oils and products of their distilla | 8.51 |
| 31 | Fertilizers | 3.01 |
| 39 | Plastics and articles thereof | 2.19 |
| 71 | Natural, cultured pearls; precious, semi-precious stones; | 1.59 |
| 10 | Cereals | 1.53 |
| 25 | Salt; sulphur; earths, stone; plastering materials, lime a | 1.44 |
| 84 | Nuclear reactors, boilers, machinery and mechanical applia | 1.27 |
| 85 | Electrical machinery and equipment and parts thereof; soun | 0.61 |
Note: FOB mirror data reported by selected partners; coverage limitations and missing observations are described in Section 5. Source: author’s calculations from UN Comtrade (2026).
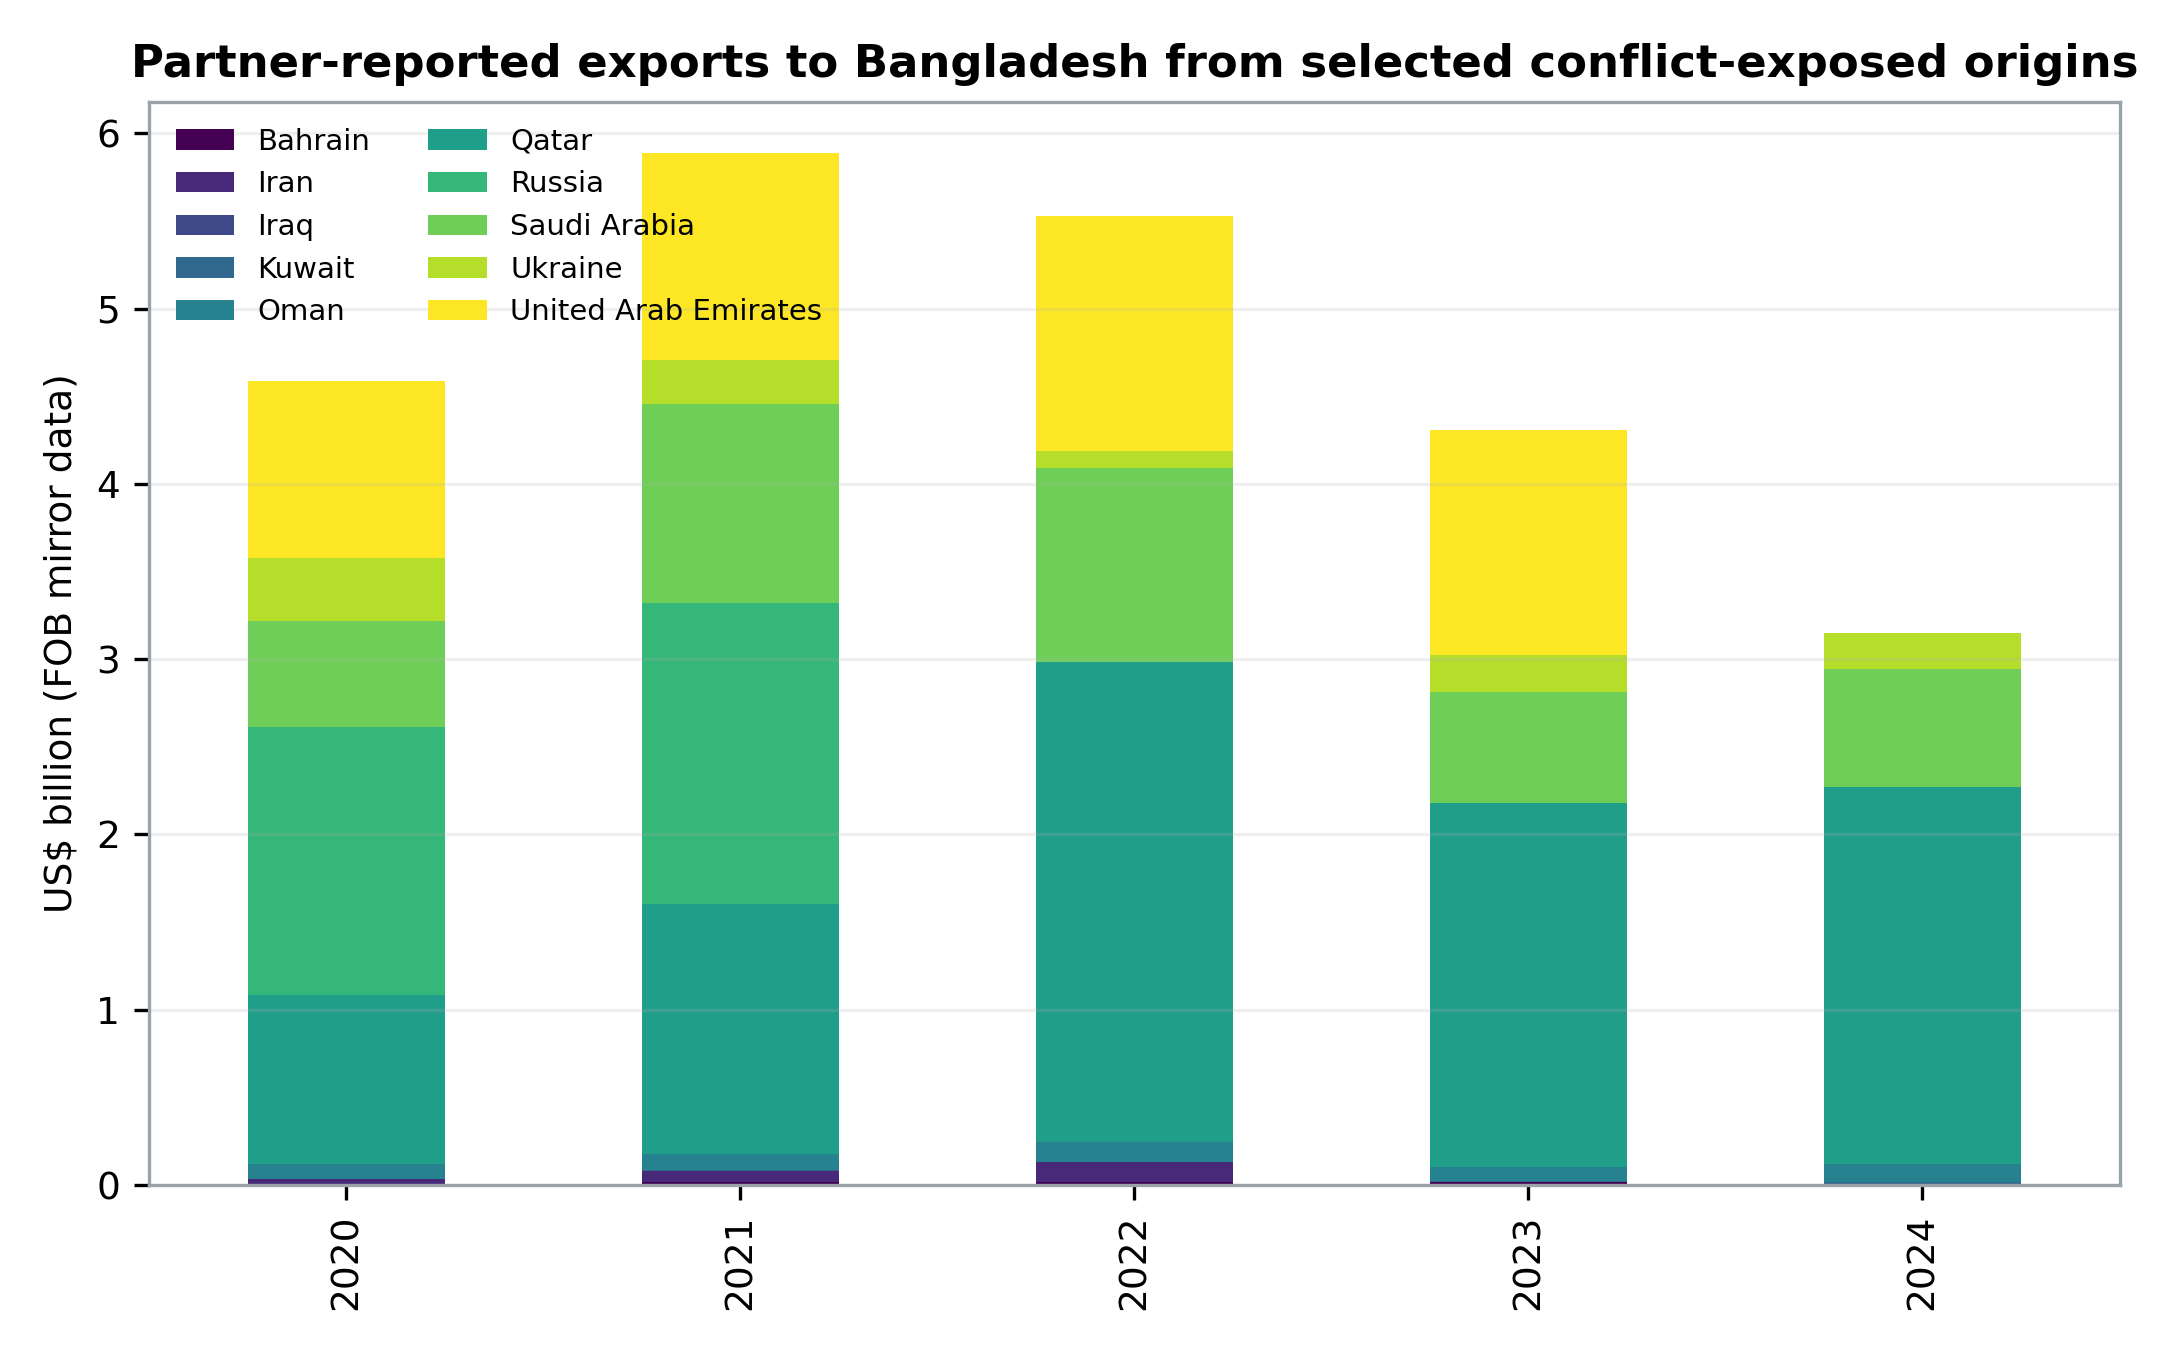
Figure 1. Partner-reported exports to Bangladesh from selected conflict-exposed origins, 2020–2024. Missing partner reports are shown as zero; values are not a complete measure of Bangladesh imports. Source: author’s calculations from UN Comtrade.
2.2 Exposure is also route- and currency-based
A shipment from a non-conflict country can still be conflict-exposed if it crosses a high-risk waterway, requires trans-shipment through a disrupted hub or is priced against a benchmark set in an affected region. The Red Sea disruption illustrates this distinction. UN Trade and Development documented the combined pressure from disruption in the Red Sea, Black Sea and Panama Canal, including longer routes and higher costs (UNCTAD, 2024). Rerouting around the Cape of Good Hope adds sailing time, fuel consumption, vessel demand and inventory days. Importers then need more trade finance for longer periods, while exporters face uncertain delivery schedules.
The US dollar is the second major exposure. Most commodity and freight contracts are denominated in dollars. If the taka depreciates, a stable US-dollar invoice becomes more expensive in domestic currency. If the commodity price and freight charge rise at the same time, depreciation magnifies both. Import restrictions or letter-of-credit constraints may reduce measured imports, but they can also ration intermediate inputs and weaken production.
3. Recent empirical and policy literature
International research identifies several recurring channels. The World Bank’s commodity-market work shows that geopolitical shocks can create sharp, uneven price movements in energy, food and fertiliser markets (World Bank, 2024a). UNCTAD (2024) emphasises the logistics channel: route diversions raise distance, freight and emissions and create particular risks for developing economies. The New York Fed’s Global Supply Chain Pressure Index combines transportation-cost and manufacturing indicators and shows how congestion and delivery pressures rose exceptionally during the pandemic before easing (Benigno et al., 2022; Federal Reserve Bank of New York, 2026).
The IMF’s PortWatch work demonstrates the value of high-frequency vessel and port data for nowcasting merchandise trade, particularly when official releases arrive with a lag (IMF, 2026). This matters for Bangladesh because an annual model cannot identify a sudden disruption quickly enough for operational decisions. Port calls, freight quotations, letters of credit, customs releases and commodity benchmarks should therefore be monitored together.
Bangladesh-focused assessments by multilateral institutions have repeatedly highlighted elevated inflation, exchange-rate pressure, energy import costs, reserve constraints and the need for macroeconomic reform (World Bank, 2024b; ADB, 2024; IMF, 2023). The domestic evidence is consistent with a layered pass-through process: external prices first affect landed cost; currency depreciation and financial constraints amplify the change; administered prices and subsidies can delay transmission; and second-round effects then operate through transport, wages and expectations. The delay means that falling global prices do not necessarily produce an immediate or equal decline in retail prices.
Exchange-rate pass-through research provides the first empirical foundation for the model. Choudhri and Hakura (2006) find across countries that the inflation environment helps explain the extent to which exchange-rate changes pass into domestic prices. Ha, Stocker and Yilmazkuday (2020) show that pass-through varies with the type of exchange-rate shock, macroeconomic conditions and country characteristics. For Bangladesh, this implies that the taka-dollar rate should not be treated as a mechanical one-for-one price converter; credibility, expectations, market structure and the composition of imports influence the speed and size of transmission.
Oil-price studies also warn against treating every increase as the same shock. Kilian (2009) separates oil-supply shocks, global aggregate-demand shocks and oil-market-specific demand shocks and finds that their macroeconomic effects differ. The distinction is policy-relevant because a conflict-related supply interruption may require a different response from a price rise caused by strong global demand. The present article uses the change in Brent as a compact external-cost indicator, but the annual sample is too small to identify these structural shocks separately.
The logistics channel is supported by Carrière-Swallow et al. (2022), who use a large cross-country panel and find that increases in global shipping costs are followed by higher import prices, producer prices, headline inflation, core inflation and inflation expectations. Their findings also suggest that the effects are stronger in economies with high import dependence and less well-anchored expectations. This supports the inclusion of supply-chain conditions in the conceptual framework, although the GSCPI is broader than a freight-rate index.
Geopolitical risk can affect trade and prices before physical supply is interrupted. Caldara and Iacoviello (2022) construct a news-based geopolitical-risk index and show that elevated risk is associated with weaker activity and trade. Auer, Borio and Filardo (2017) further demonstrate that global value-chain linkages have increased the role of global factors in domestic inflation. Taken together, these studies justify examining conflict, international input prices, shipping conditions and exchange-rate movements as connected rather than isolated channels.
The literature nevertheless cautions against over-identification. A full VAR would treat several variables as jointly endogenous and trace dynamic shocks through impulse responses, while a VECM would additionally require evidence that non-stationary level variables are cointegrated. This article does not make either claim. Its econometric exercise is a deliberately small, single-equation pass-through model designed to quantify conditional historical associations and complement, not replace, the descriptive and institutional analysis.
4. Analytical framework
The landed taka cost of an imported product can be expressed conceptually as the dollar commodity price plus freight, insurance and other charges, multiplied by the taka–dollar exchange rate, with tariffs, taxes, port charges and domestic margins added thereafter. This accounting identity clarifies why focusing only on the international spot price is incomplete.
Four stages link conflict to the domestic economy. First, conflict changes expected availability and risk, moving benchmark prices and insurance. Second, shipping disruptions change route distance, vessel capacity and delivery time. Third, foreign-exchange scarcity and depreciation translate dollar costs into taka and can restrict access to inputs. Fourth, firms and public utilities decide how much of the cost to absorb, finance or pass on. The final effect depends on market competition, inventories, administered pricing, subsidy policy and household demand.
For exports, the exchange-rate effect is ambiguous. Depreciation can raise taka revenue from a dollar sale, but the advantage is smaller when exporters use imported fuel, cotton, chemicals, machinery and transport services. Longer lead times can also damage reliability, a key non-price component of competitiveness. Energy shortages reduce capacity utilisation and can make air freight or expedited shipping necessary. The net effect differs across firms according to import intensity, energy efficiency, bargaining power and access to finance.
5. Data and methodology
5.1 Data sources and construction
The descriptive dataset combines five sources. Annual CPI inflation, the official exchange rate and merchandise trade values are taken from the World Bank’s World Development Indicators. Monthly Brent crude prices are taken from the World Bank Pink Sheet and averaged to calendar years. Monthly observations of the New York Fed’s Global Supply Chain Pressure Index are likewise averaged to calendar years. Bilateral product exposure uses exports reported by selected partners to Bangladesh in UN Comtrade at the HS two-digit level for 2020–2024.
Mirror trade is used because Bangladesh’s recent direct annual observations were not available in the public Comtrade series used for this study. Mirror data are valuable but are not identical to Bangladesh’s recorded imports: exports are normally valued FOB while imports are normally valued cost, insurance and freight; reporting dates can differ; re-exports may be attributed differently; and public preview access produced gaps for some partner-years. Partner values are therefore used to identify product patterns rather than to claim a complete measure of Bangladesh’s imports. Tables carry this caveat explicitly.
5.2 Econometric model and variables
The study estimates a single-equation dynamic OLS model. In time-series terminology, its structure is an ADL(1,0,0,0): current inflation depends on one lag of inflation and the current values of three explanatory variables. It is not a VAR, because the study does not estimate a system in which every variable is jointly endogenous. It is not a VECM, because no long-run cointegrating relationship among non-stationary level variables is specified or estimated. It is also not an ARDL bounds-testing exercise. The purpose is narrower: to examine conditional annual associations between inflation, exchange-rate depreciation, changes in Brent prices and global supply-chain pressure.
The population equation is:
πₜ = α + β₁[100Δln(Eₜ)] + β₂[100Δln(Bₜ)] + β₃Gₜ + ρπₜ₋₁ + uₜ
where t denotes year and Δ is the first-difference operator. Multiplication by 100 converts the log changes in the exchange rate and Brent price into approximate percentage changes. The expected signs are β₁ > 0, β₂ > 0 and ρ > 0. The sign of β₃ is expected to be positive in a sufficiently rich model, but annual averaging, timing differences and overlap with oil and exchange-rate movements can make its coefficient unstable in this small sample.
Table 2A. Definition and measurement of econometric variables
| Symbol | Definition | Unit | Source |
|---|---|---|---|
| πₜ | Annual CPI inflation in Bangladesh | Per cent | WDI |
| Eₜ | Official exchange rate, Bangladesh taka per US dollar | Tk/US$, annual average | WDI |
| 100Δln(Eₜ) | Approximate annual percentage depreciation of the taka; a positive value means more taka per US dollar | Per cent | Author’s calculation |
| Bₜ | Brent crude-oil price | US$/barrel, annual average | World Bank Pink Sheet |
| 100Δln(Bₜ) | Approximate annual percentage change in the Brent price | Per cent | Author’s calculation |
| Gₜ | Global Supply Chain Pressure Index | Standard deviations from historical average; annual mean | New York Fed |
| πₜ₋₁ | Inflation in the preceding year | Per cent | WDI/author’s lag |
| uₜ | Unobserved error term, including omitted domestic and external influences | Not observed | Model term |
Note: ln denotes the natural logarithm. The estimation sample is 2002–2024 after transformation and lagging.
5.3 Estimation and limitations
The coefficients are estimated by OLS using 23 annual observations. Statistical inference uses Newey–West HAC standard errors with one annual lag to reduce sensitivity to heteroskedasticity and first-order serial correlation in the residual covariance matrix. The HAC correction changes the estimated standard errors, not the OLS coefficient estimates. The model is deliberately parsimonious because the sample is small.
The specification omits domestic food-supply shocks, administered-price changes, monetary and fiscal conditions, taxes, subsidies and expectations. Contemporaneous explanatory variables may also be endogenous, and a lagged dependent variable can create finite-sample bias. No causal identification strategy is claimed. The results should therefore be read as exploratory historical associations. A later study using monthly or quarterly data could test integration and cointegration formally and, depending on those results, estimate a larger ARDL, VAR or VECM with impulse-response analysis.
6. Descriptive statistics and recent trends
Table 2. Selected Bangladesh and global indicators, 2019–2025
| Year | Tk/US$ | Inflation % | Imports US$bn | Exports US$bn | Brent $/bbl | GSCPI |
|---|---|---|---|---|---|---|
| 2019 | 84.5 | 5.6 | 59.1 | 39.3 | 64.0 | -0.06 |
| 2020 | 84.9 | 5.7 | 52.8 | 33.6 | 42.3 | 1.64 |
| 2021 | 85.1 | 5.5 | 80.4 | 44.2 | 70.4 | 3.04 |
| 2022 | 91.7 | 7.7 | 88.2 | 51.4 | 99.8 | 2.17 |
| 2023 | 106.3 | 9.9 | 66.9 | 44.2 | 82.6 | -0.62 |
| 2024 | 115.6 | 10.5 | 67.9 | 47.2 | 80.7 | -0.29 |
| 2025 | 121.9 | 8.8 | 69.4 | 48.2 | — | 0.00 |
Note: Merchandise trade is current US dollars. Pink Sheet in the downloaded file ends in 2024; 2025 cells therefore remain blank where not available. Sources: World Bank (2024a; 2026a), Federal Reserve Bank of New York (2026).
Three changes stand out. First, the annual-average exchange rate was broadly stable through 2021, then depreciated markedly: from Tk85.1 per dollar in 2021 to Tk115.6 in 2024, a rise of roughly 36% in the domestic-currency price of a dollar. Second, inflation accelerated from 5.5% in 2021 to 7.7% in 2022, 9.9% in 2023 and 10.5% in 2024. Third, merchandise imports surged in 2021–2022 before falling in 2023, consistent with both weaker demand and external-financing constraints; exports also declined in 2023 before partially recovering in 2024.
Brent averaged US$99.8 per barrel in 2022, compared with US$42.3 in 2020. The GSCPI peaked on an annual-average basis in 2021 and eased thereafter. This divergence is informative: aggregate global supply-chain pressure can normalise while Bangladesh still faces high domestic prices because exchange-rate depreciation, lagged contracts, financing costs and administered-price adjustments continue to transmit earlier shocks.
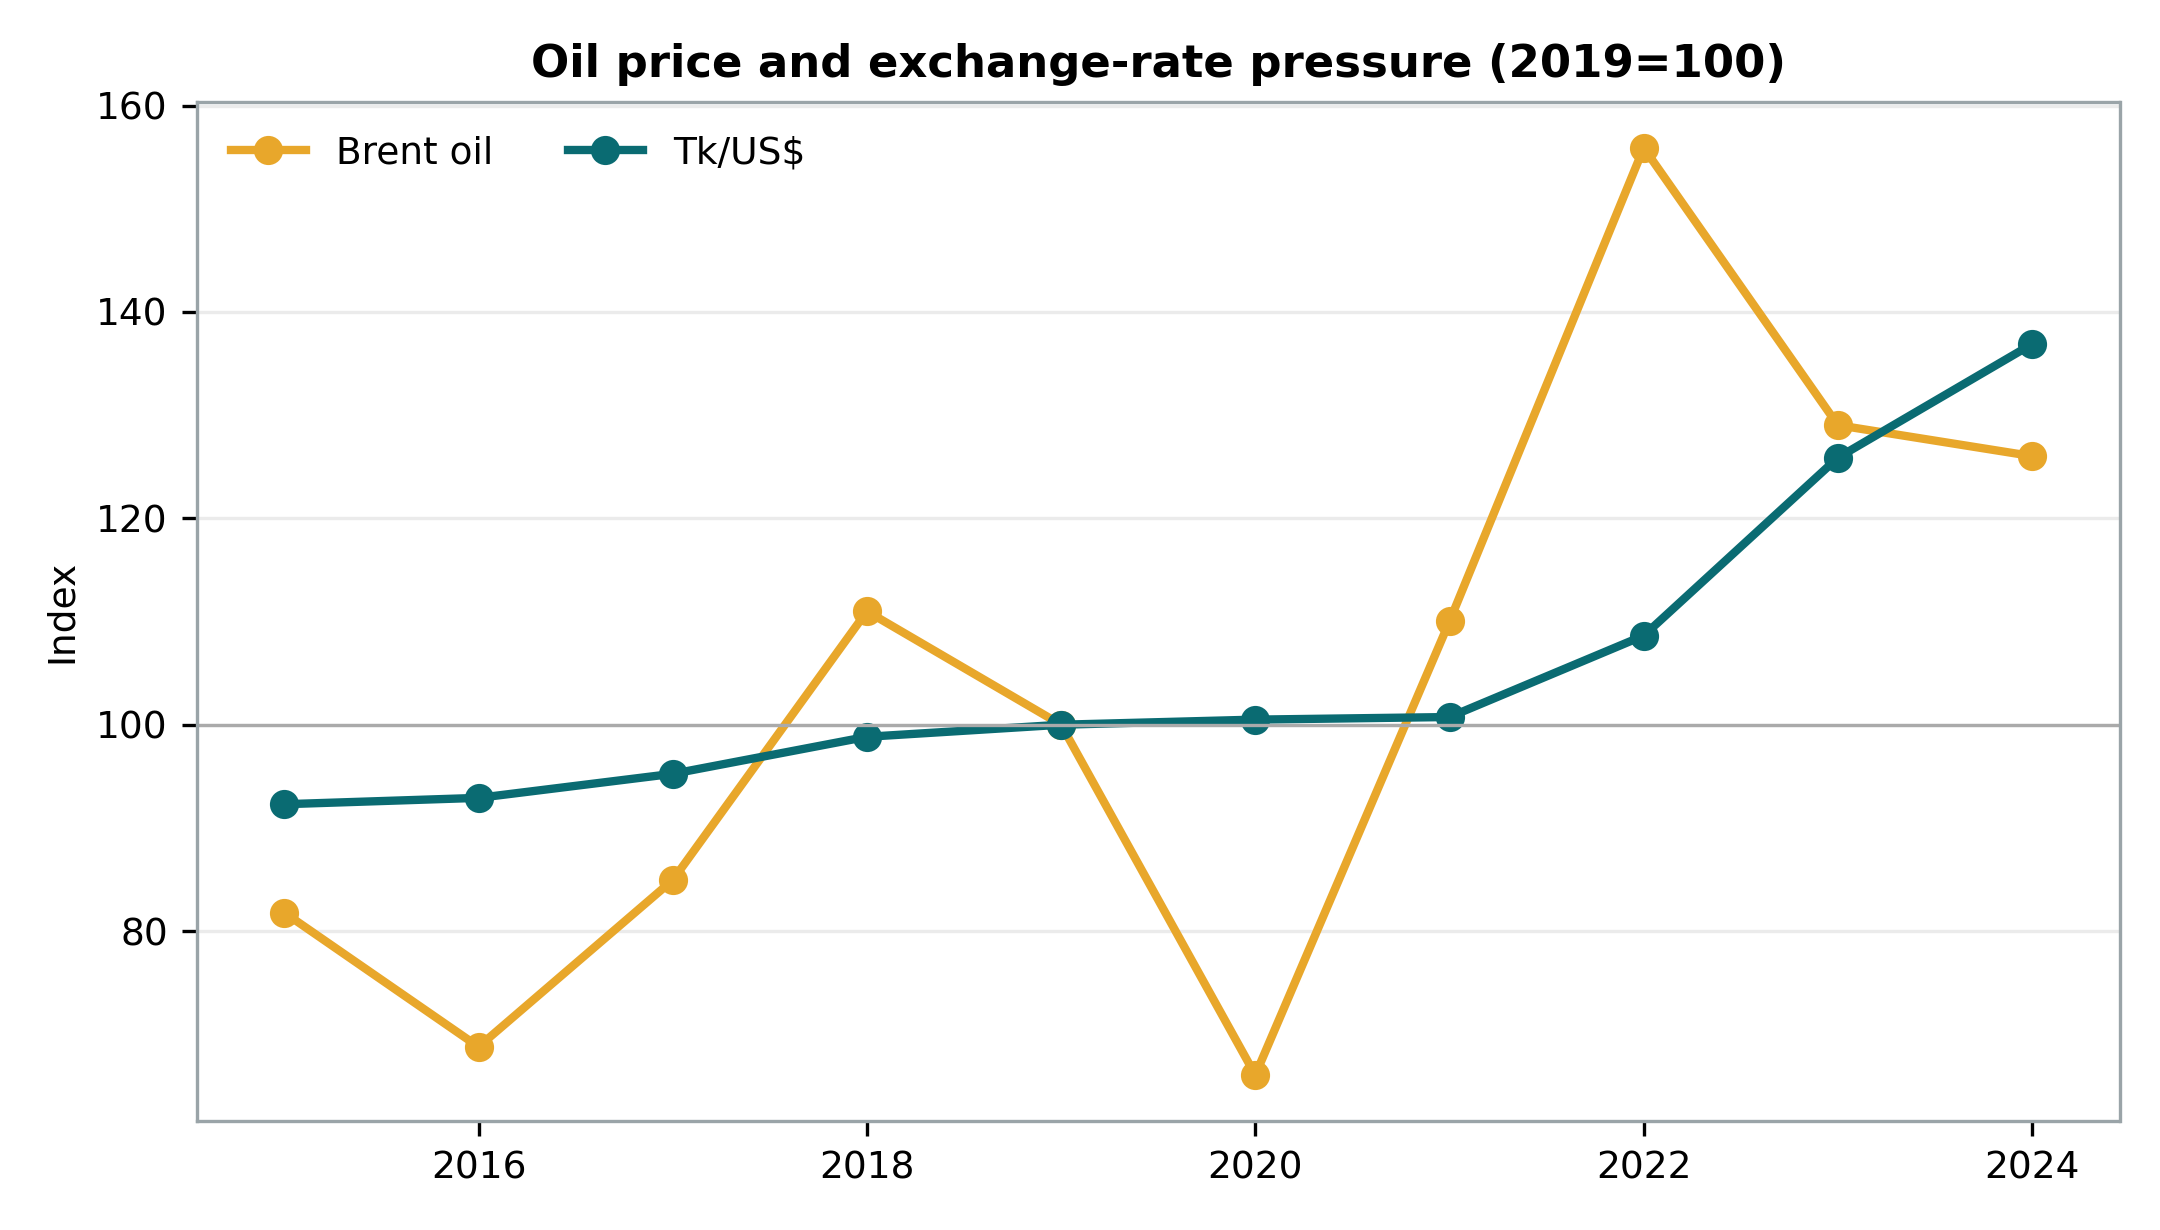
Figure 2. Brent oil price and Bangladesh exchange rate, indexed to 2019=100. Sources: World Bank Pink Sheet and World Development Indicators.
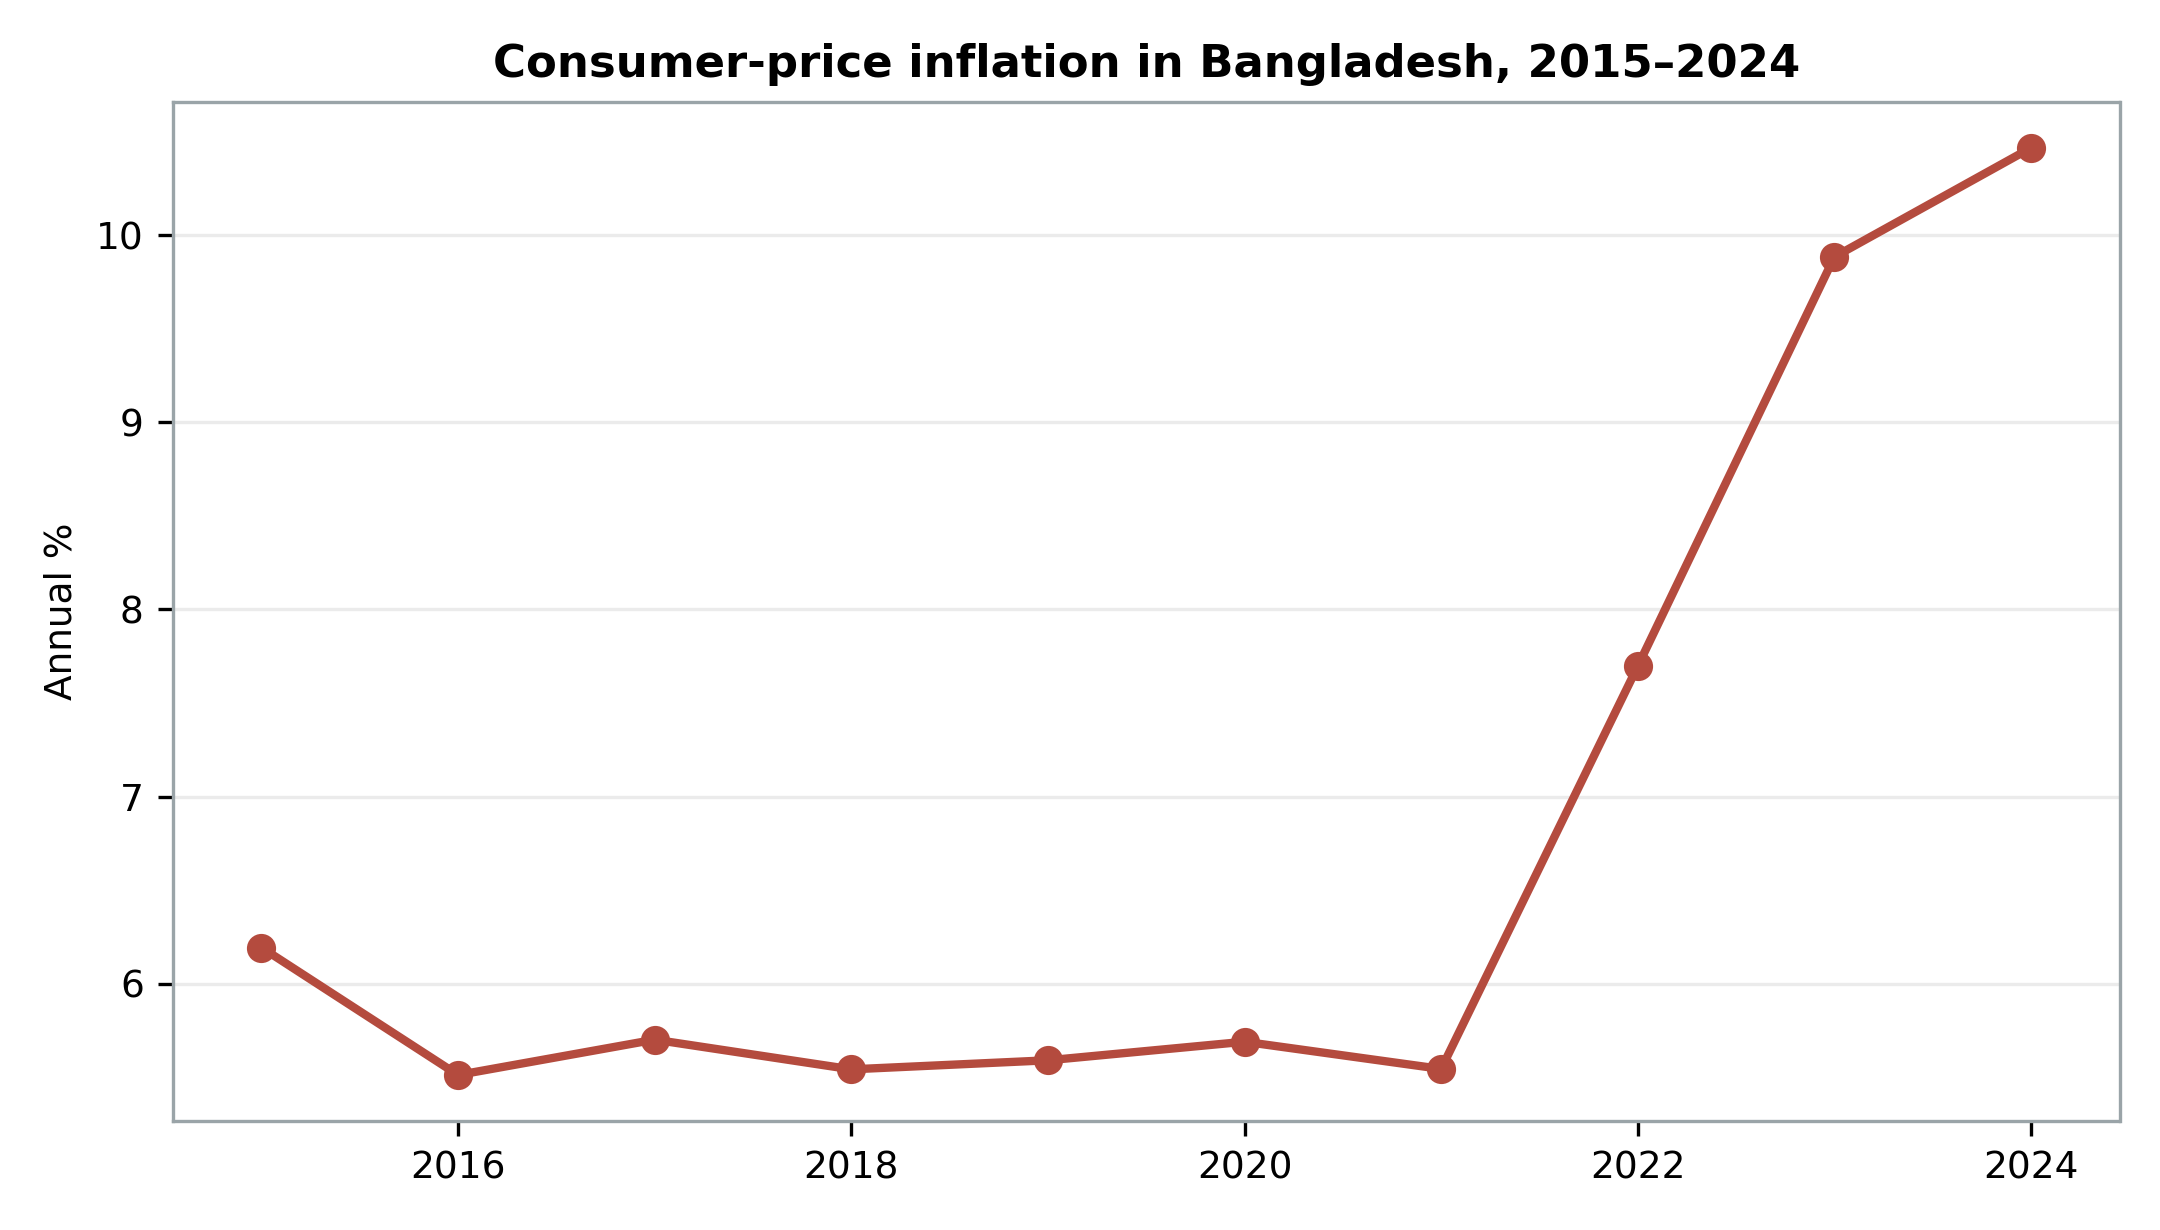
Figure 3. Bangladesh consumer-price inflation, 2015–2024. Source: World Development Indicators.
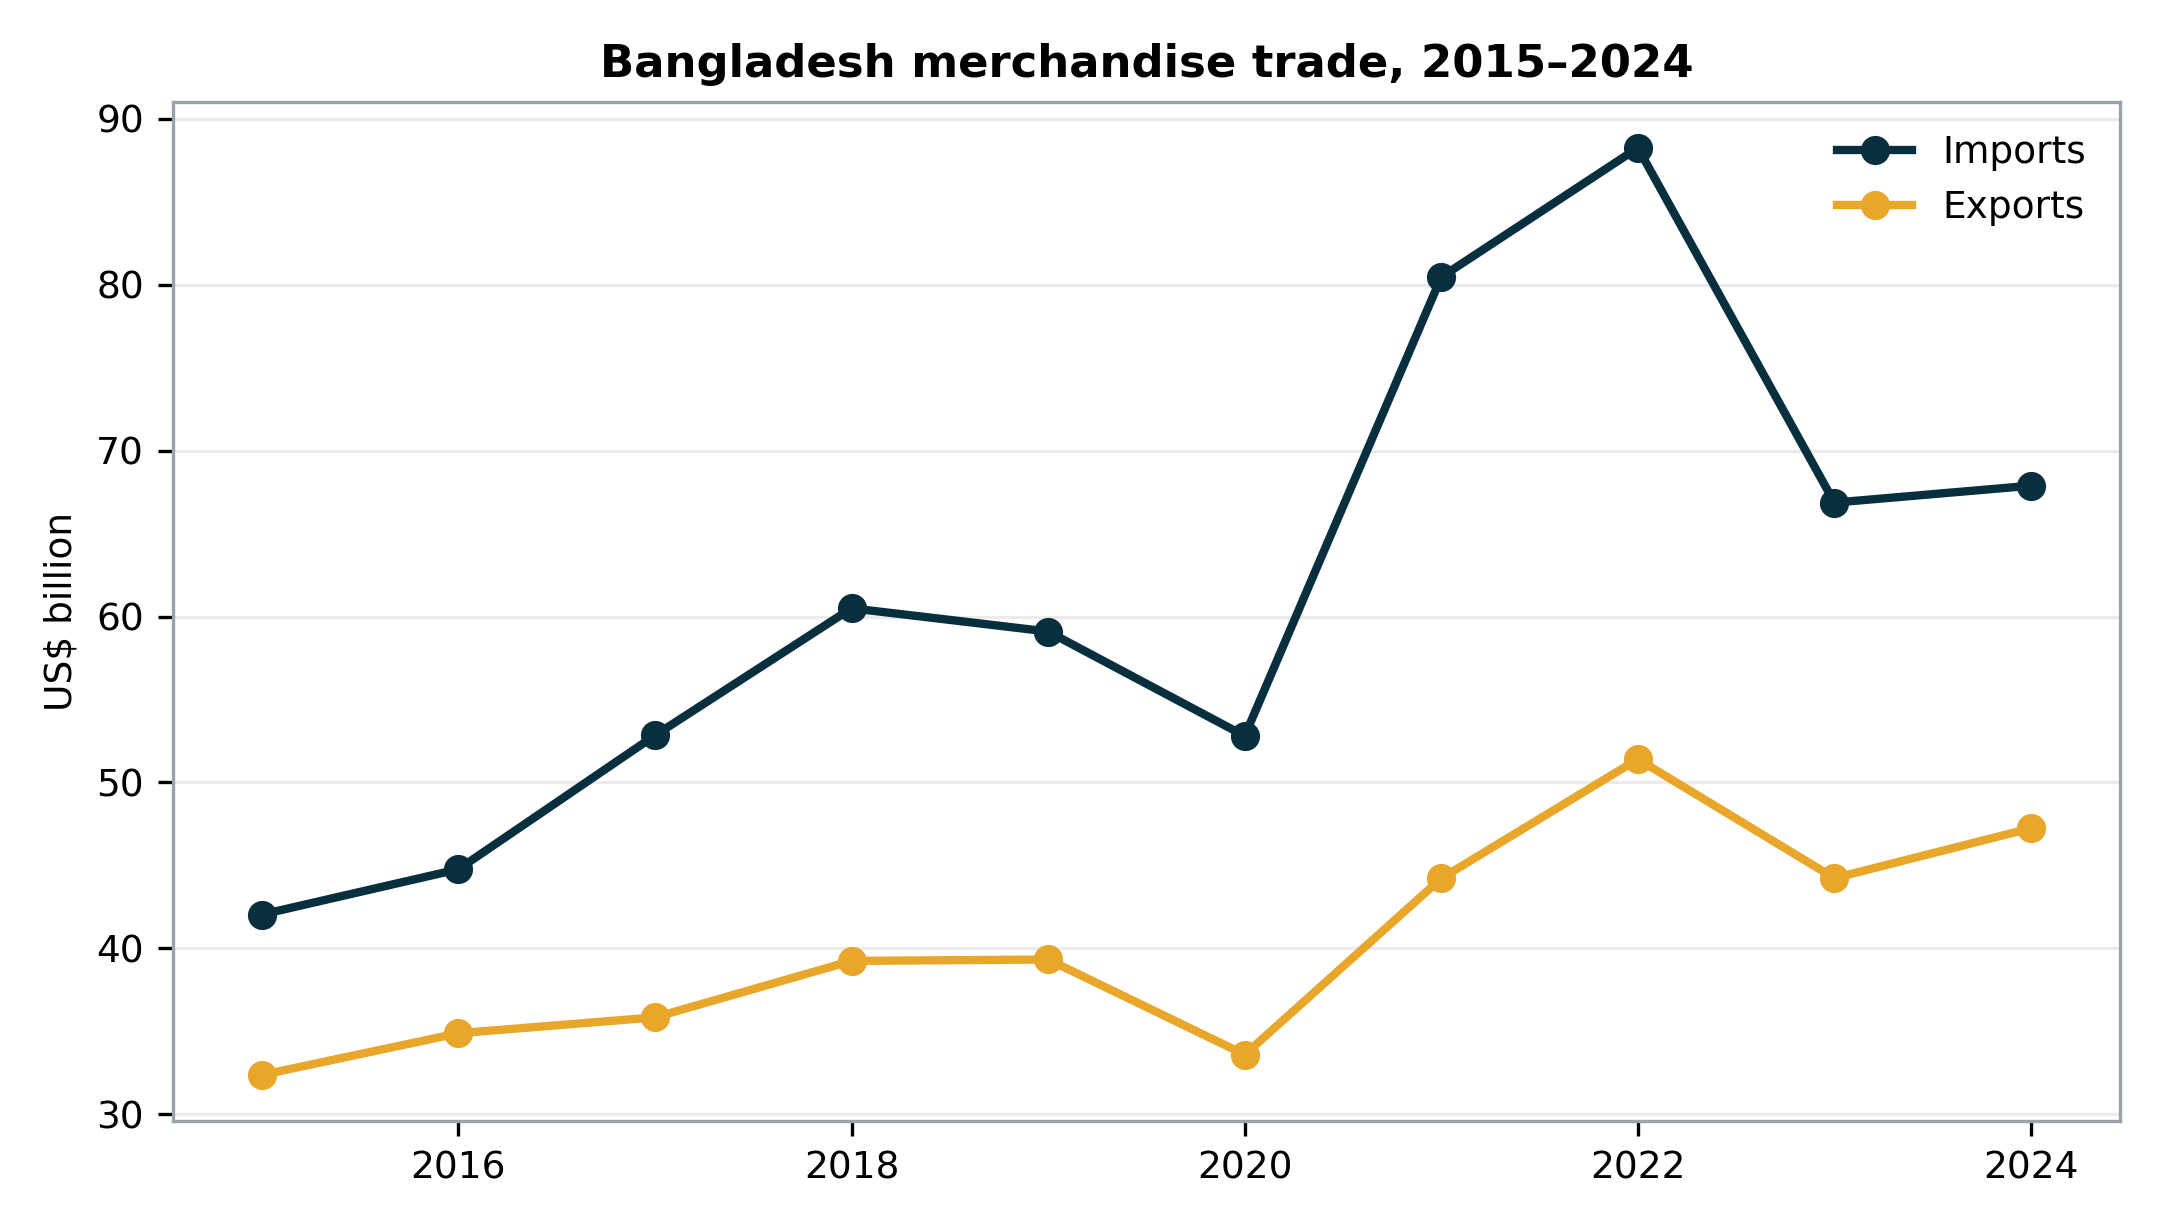
Figure 4. Bangladesh merchandise imports and exports, 2015–2024. Source: World Development Indicators.
7. Econometric analysis
7.1 Model specification and estimated equation
The results come from the dynamic single-equation OLS model defined in Section 5. They do not come from a VAR or VECM. Substituting the estimated coefficients gives:
π̂ₜ = 3.647 + 0.051[100Δln(Eₜ)] + 0.021[100Δln(Bₜ)] − 0.208Gₜ + 0.470πₜ₋₁
The equation reports point estimates. Statistical uncertainty must be assessed from the HAC standard errors and p-values in Table 3; a coefficient’s sign alone is not evidence of a reliable effect.
Table 3. Exploratory inflation model, 2002–2024
| Variable | Coefficient | HAC s.e. | t | p-value |
|---|---|---|---|---|
| Constant | 3.647 | 1.248 | 2.92 | 0.009 |
| Δ ln(Tk/US$), % | 0.051 | 0.100 | 0.51 | 0.615 |
| Δ ln(Brent), % | 0.021 | 0.011 | 1.99 | 0.063 |
| GSCPI, annual mean | -0.208 | 0.198 | -1.05 | 0.307 |
| Inflation, lagged | 0.470 | 0.185 | 2.54 | 0.021 |
N=23; R²=0.378; adjusted R²=0.239. Newey–West standard errors with one lag. Dependent variable: annual CPI inflation (%). Source: author’s estimates.
The Brent coefficient is 0.021: a 10% annual rise in Brent is associated with about 0.21 percentage points higher inflation, holding the other included factors constant. Its p-value is 0.063, so it is statistically significant at the 10% level but not at the conventional 5% level. Lagged inflation is positive and statistically significant, consistent with persistence. The exchange-rate coefficient is positive but imprecise. The GSCPI coefficient is negative and statistically insignificant after controlling for the other variables, an outcome that may reflect timing, multicollinearity, annual averaging and Bangladesh-specific bottlenecks not captured by the global index.
The model explains about 38% of annual inflation variation. It should not be used to assert that oil alone caused a particular retail-price increase or to forecast the effect of the September 2026 shock. Its value is narrower: it supports the proposition that external energy prices and domestic inflation co-move after accounting for persistence, while reminding the reader that the magnitude and timing of pass-through depend on omitted domestic institutions and shocks.
8. Discussion: effects on domestic prices and exports
8.1 Domestic prices and household welfare
Fuel is both a final consumption item and a general input. A diesel increase affects buses, trucks, irrigation pumps, generators and distribution margins. LNG and other energy costs affect power generation and industrial production. Fertiliser and transport costs reach food prices with a lag, while higher food prices disproportionately burden lower-income households. A uniform subsidy may restrain the visible price temporarily but can create fiscal losses, encourage inefficient use and postpone adjustment. Abrupt catch-up increases then intensify the shock.
Exchange-rate depreciation broadens the pass-through beyond energy. Edible oil, wheat, pulses, chemicals, pharmaceuticals inputs, machinery and spare parts become more expensive in taka. Import financing can add another layer: a longer voyage ties up credit, higher interest rates raise carrying cost, and scarce dollars can create an informal premium or delayed letters of credit. Retail prices also depend on domestic competition, stocks and enforcement; therefore a global shock can be amplified by weak market information or opportunistic margins.
8.2 Export competitiveness
The garment sector and other exporters may gain accounting revenue from depreciation, but imported-input and energy costs offset part of that gain. Firms operating on thin margins or fixed-price contracts cannot immediately pass higher costs to buyers. Power interruptions, generator fuel and delayed raw materials reduce productivity and reliability. Small suppliers generally face higher finance costs and weaker bargaining power than large firms.
The export response is therefore a balance-sheet and logistics issue as much as a price issue. Stable access to energy, predictable customs release, reliable port operations and working-capital finance may matter more than a temporary exchange-rate advantage. Diversification into less energy-intensive and higher-value products improves resilience, but it requires standards, skills, technology and market access rather than exchange-rate adjustment alone.
9. Recommendations
| Priority | Recommended action |
|---|---|
| Immediate monitoring | Publish a weekly dashboard of fuel benchmarks, LNG, freight, insurance, exchange rates, letters of credit and port dwell times; distinguish global cost from domestic tax and margin. |
| Price adjustment | Use a transparent, rules-based fuel formula with a smoothing band; publish calculations and avoid long freezes followed by large jumps. |
| Targeted protection | Replace broad price suppression with temporary, well-targeted transfers or transport support for vulnerable households. |
| Trade finance | Prioritise transparent access to foreign exchange and working capital for essential inputs and viable exporters; avoid opaque rationing. |
| Supply resilience | Diversify suppliers and routes, establish risk-based minimum stocks for critical fuel, food and fertiliser, and use framework contracts rather than a single origin. |
| Ports and customs | Extend electronic documentation, risk-based inspection and coordinated port operations to reduce dwell time and inventory cost. |
| Export support | Offer time-bound efficiency finance for energy-saving machinery, rooftop solar, waste-heat recovery and logistics digitalisation; do not subsidise inefficient fuel use indefinitely. |
| Risk management | Develop institutional capability for commodity hedging and freight contracting under clear governance, exposure limits and disclosure. |
| Data | Improve timely publication of detailed import values, volumes, freight and unit values; reconcile customs, central-bank and port data. |
Sequencing matters. The first step is credible information: policy cannot distinguish a temporary freight spike from a persistent energy shock without timely data. The second is targeted cushioning while prices adjust. The third is structural reduction of import intensity through energy efficiency, domestic renewable capacity, better logistics and export diversification. Strategic stocks should be calibrated to disruption risk and carrying cost; excessive stocks can be as costly as insufficient stocks.
Business associations and firms also have a role. Importers can map second-tier suppliers, negotiate alternative ports, split critical orders, stress-test cash flow and include transparent freight-adjustment clauses. Exporters can measure imported-input intensity and energy use per unit, because those metrics reveal whether currency depreciation is truly improving competitiveness. Joint procurement or shared warehousing may help smaller firms, provided competition rules and governance are respected.
10. Conclusion
Bangladesh’s exposure to war and geopolitical tension is not confined to imports originating in the countries at war. The more important risk can be systemic: a benchmark price rises, a ship takes a longer route, an insurer charges more, the dollar strengthens and domestic finance tightens at the same time. These layers explain why retail prices may remain high even after a global index begins to ease.
Historical data show a clear period of exchange-rate depreciation and elevated inflation after 2021. The exploratory model finds a positive oil-price association and substantial inflation persistence but cannot establish causality or quantify the current 2026 shock. Policy should therefore avoid false precision. A resilient response combines transparent pricing, targeted household support, foreign-exchange and trade-finance reforms, route and supplier diversification, efficient ports, strategic inventories and lower energy intensity. For exporters, reliability and productivity are the durable sources of competitiveness; depreciation alone is not a development strategy.
References
Asian Development Bank (ADB) (2024) Asian Development Outlook September 2024. Manila: ADB. Available at: https://www.adb.org/publications/asian-development-outlook-september-2024 (Accessed: 21 September 2026).
Benigno, G., di Giovanni, J., Groen, J.J.J. and Noble, A.I. (2022) “A new barometer of global supply chain pressures”, Federal Reserve Bank of New York Liberty Street Economics, 4 January. Available at: https://libertystreeteconomics.newyorkfed.org/2022/01/a-new-barometer-of-global-supply-chain-pressures/ (Accessed: 21 September 2026).
Federal Reserve Bank of New York (2026) Global Supply Chain Pressure Index. Available at: https://www.newyorkfed.org/research/policy/gscpi (Accessed: 21 September 2026).
International Monetary Fund (IMF) (2023) Bangladesh: 2023 Article IV Consultation, First Reviews Under the Extended Credit Facility, Extended Fund Facility, and Resilience and Sustainability Facility. Washington, DC: IMF. Available at: https://www.imf.org/en/Publications/CR/Issues/2023/12/12/Bangladesh-2023-Article-IV-Consultation-First-Reviews-Under-the-Extended-Credit-Facility-542681 (Accessed: 21 September 2026).
International Monetary Fund (IMF) (2026) Nowcasting country-level trade estimates using IMF PortWatch. IMF Working Paper. Available at: https://www.imf.org/en/publications/wp/issues/2026/05/19/nowcasting-country-level-trade-estimates-using-imf-portwatch-576176 (Accessed: 21 September 2026).
Reuters (2026a) “Bangladesh raises fuel prices by up to 17% amid global oil price surge”, 21 September. Available at: https://www.reuters.com/business/energy/bangladesh-raises-fuel-prices-by-up-17-amid-global-oil-price-surge-2026-09-21/ (Accessed: 21 September 2026).
Reuters (2026b) “Energy disruption hits Bangladesh, Pakistan as Gulf crisis worsens”, 17 September. Available at: https://www.reuters.com/business/energy/energy-disruption-hits-bangladesh-pakistan-as-gulf-crisis-worsens-2026-09-17/ (Accessed: 21 September 2026).
Reuters (2026c) “Bangladesh’s industrial growth hurt by high LNG prices, minister says”, 14 September. Available at: https://www.reuters.com/business/energy/bangladeshs-industrial-growth-hurt-by-high-lng-prices-minister-says-2026-09-14/ (Accessed: 21 September 2026).
UN Trade and Development (UNCTAD) (2024) Navigating troubled waters: Impact to global trade of disruption of shipping routes in the Red Sea, Black Sea and Panama Canal. Geneva: UNCTAD. Available at: https://unctad.org/news/navigating-troubled-waters-impact-global-trade-disruption-shipping-routes-red-sea-black-sea (Accessed: 21 September 2026).
United Nations Statistics Division (2026) UN Comtrade Database. Available at: https://comtradeplus.un.org/ (Accessed: 21 September 2026).
World Bank (2024a) Commodity Markets Outlook, April 2024. Washington, DC: World Bank. Available at: https://www.worldbank.org/en/research/commodity-markets (Accessed: 21 September 2026).
World Bank (2024b) Bangladesh Development Update. Washington, DC: World Bank. Available at: https://www.worldbank.org/en/country/bangladesh/publication/bangladesh-development-update (Accessed: 21 September 2026).
World Bank (2026a) World Development Indicators. Available at: https://databank.worldbank.org/source/world-development-indicators (Accessed: 21 September 2026).
World Bank (2026b) Commodity Price Data (The Pink Sheet). Available at: https://www.worldbank.org/en/research/commodity-markets (Accessed: 21 September 2026).
Auer, R.A., Borio, C.E.V. and Filardo, A.J. (2017) “The globalisation of inflation: the growing importance of global value chains”, BIS Working Papers, No. 602. Basel: Bank for International Settlements. Available at: https://www.bis.org/publ/work602.htm (Accessed: 21 September 2026).
Caldara, D. and Iacoviello, M. (2022) “Measuring geopolitical risk”, American Economic Review, 112(4), pp. 1194–1225. doi: 10.1257/aer.20191823.
Carrière-Swallow, Y., Deb, P., Furceri, D., Jiménez, D. and Ostry, J.D. (2022) Shipping costs and inflation. IMF Working Paper WP/22/61. Washington, DC: International Monetary Fund. doi: 10.5089/9798400204685.001.
Choudhri, E.U. and Hakura, D.S. (2006) “Exchange rate pass-through to domestic prices: Does the inflationary environment matter?”, Journal of International Money and Finance, 25(4), pp. 614–639. doi: 10.1016/j.jimonfin.2005.11.009.
Ha, J., Stocker, M. and Yilmazkuday, H. (2020) “Inflation and exchange rate pass-through”, Journal of International Money and Finance, 105, 102187. doi: 10.1016/j.jimonfin.2020.102187.
Kilian, L. (2009) “Not all oil price shocks are alike: Disentangling demand and supply shocks in the crude oil market”, American Economic Review, 99(3), pp. 1053–1069. doi: 10.1257/aer.99.3.1053.
Appendix A. Interpretation and reproducibility notes
Annual percentage changes in the exchange rate and Brent are calculated as 100 times the first difference of their natural logarithms. GSCPI is the annual mean of monthly observations. The reported estimator is dynamic OLS with one lag of inflation; Newey–West HAC standard errors use one lag. No unit-root, cointegration, VAR or VECM procedure is reported. Figures and tables were generated from downloaded source files; rounding may produce small differences. Product descriptions follow the Harmonized System chapter labels returned by UN Comtrade.
The article separates verified historical observations from the current 2026 context. Current-event reports can change as market information is revised. Readers making commercial or policy decisions should consult the latest official notices, contracts, customs data and market quotations.
Back to top ↑